
Measure Data Architecture
Published in Governance, 2024
Table of contents
- Current State Assessment
- Future State: Relevant and viable
- Data Architecture Gaps Analysis
- Strategic Initiatives to Close Gaps
During my Master’s thesis, I focused on measuring architecture programs within enterprises, which ingrained in me the importance of measurement in all aspects of work. While most metrics may not perfectly capture reality or predict outcomes with complete accuracy, they are certainly better than having no metrics at all.
Below are the most common target visions of data and anlytics organizations
- Improved Data Integration: Seamless integration of data across warehouse operations, enabling a holistic view of performance and more comprehensive analysis.
- Higher Data Quality: Automated data quality processes leading to more accurate and consistent data, reducing discrepancies in inventory levels and shipment status.
- Real-Time Operational Insights: Real-time dashboards and reports that provide actionable insights into warehouse operations, enabling quicker and more informed decision-making.
- Predictive Analytics Capabilities: The ability to forecast demand, optimize stock levels, and plan warehouse layouts using predictive models, resulting in reduced costs and improved efficiency.
- Data-Driven Culture: A transformation in how decisions are made in warehouse operations, with data-driven insights guiding strategic and operational decisions.
In a page on Data Domains, I recommended building data domains aligned with business capability maps to support federated data management and governance. However, it’s crucial to ensure consistency in what we measure and how we measure these data domains.
As part of a large transformation program, I was tasked with developing a framework to assess our current position and create a roadmap for where we need to go. I quickly realized that this was a politically sensitive endeavor. Rather than relying solely on financial metrics, which are typically used at a portfolio level, we needed a method to provide a more holistic perspective on data management.
To achieve this, I employed a four-point scale to evaluate various dimensions of the architecture, as well as its lifecycle stages, from the current state (as-is) to full implementation.
Below is an example of a data domain and some of the dimensions which we typically manage in any enterprise.
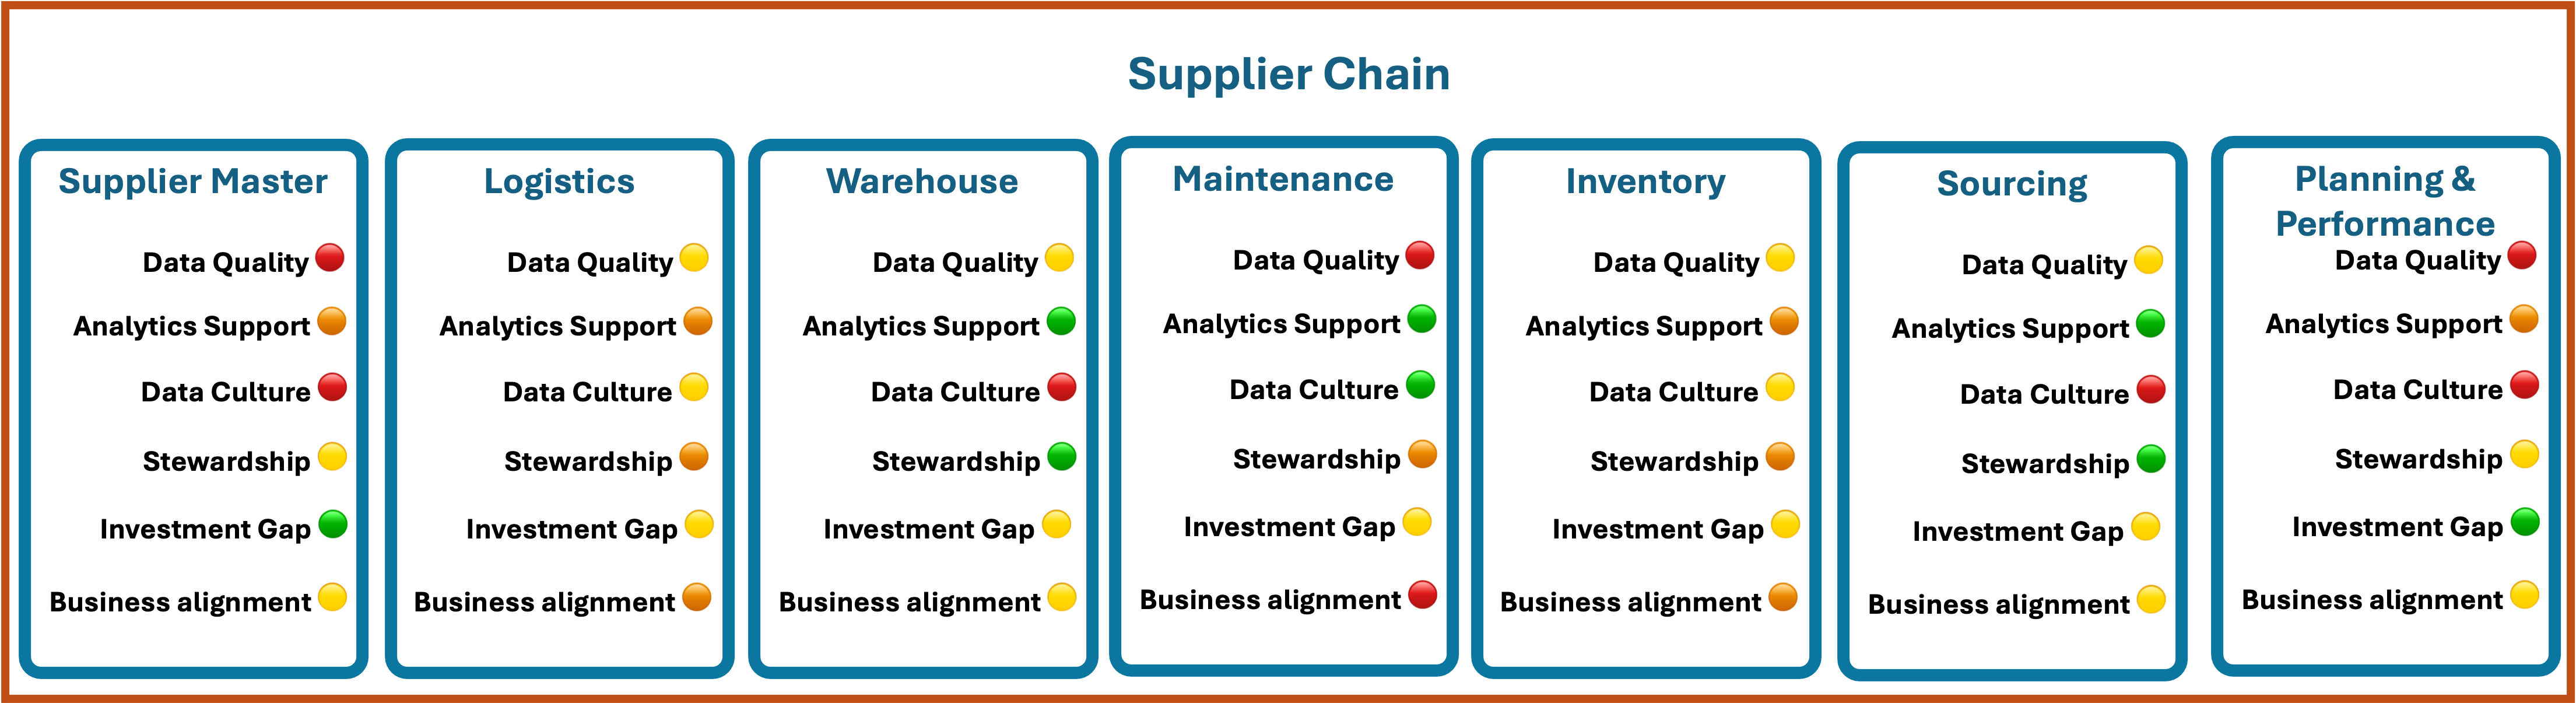
Achieving escape velocity in collecting data for conducting a strategic gap analysis and measuring alignment to initiatives can be tricky. A straightforward scoring system is essential for identifying key gaps within a data domain, such as technology limitations, process inefficiencies, skills shortages, and cultural challenges. By addressing these gaps through targeted initiatives, the organization can progress toward a more efficient, data-driven warehouse operation, better equipped to meet the demands of modern supply chain management.
Below is an example of a strategic gap analysis focused on the data domain related to warehouse operations within an organization. This analysis identifies the current and desired future states, gaps, and strategic initiatives to close those gaps, aiming to optimize warehouse operations, reduce costs, and improve inventory accuracy through data-driven insights.
Step 1. Current State Assessment
Before I explain this phase, I would like to call out that a current state assessment is not a one-time activity. Governance needs to establish a process for regularly reviewing and updating the assessment to reflect changes in the organization and its environment. We need to implement mechanisms for continuous feedback and improvement to ensure that the organization remains aligned with its goals and adapts to evolving needs.
There is a sense of either overestimating or underestimating the current state of an organization or domain’s data and analytics capabilities. There a those who atttent conferences and are easily convinced by the sales pitches and under-rate the current capabilities within the oranization. And there are those who are resistent to change and overrate their current capabilities. So it is important to benchmark against similar business and size industry standard. However best practices are there for a reason and there is much wisdom in it. Compare the organization’s current state against industry best practices and standards. Work with vendors to understand and assess an organization’s capabilities. Get multiple opinions so that there is no bias.
What gaps do we measure?
- Business Performance & Operational Efficiency: Impact on revenue, cost efficiency, customer satisfaction, or other key business metrics such as process efficiency, resource utilization, or productivity.
- Compliance and Risk: Impact on regulatory compliance, security, or exposure to risks.
- Technology Alignment: Impact on the alignment of technology with business needs, scalability, and maintainability.
- Data Quality and Accessibility: Impact on the quality, accuracy, and accessibility of data.
- User Experience: Impact on the experience of end-users, including usability and satisfaction.
- Strategic Alignment: Impact on the alignment of the architecture with the organization’s strategic goals and objectives.
Gap Impact Scoring System
Measuring the impact of a gap in an architecture using a scale from 1 to 4 (with 1 being Minor and 4 being Extensive) involves evaluating how the gap affects various aspects of the organization’s operations, goals, and performance. Here’s a structured approach to assess the impact.
4 - Extensive Impact
The gap severely disrupts or undermines critical business operations, poses a significant risk to the organization, or completely misaligns with strategic objectives. Ex: A gap that prevents the organization from complying with major regulatory requirements, leading to potential fines or legal actions.
3 - Significant Impact
The gap considerably affects important areas of the business, causing notable inefficiencies, increased costs, or misalignment with key objectives. Ex. A gap that causes frequent system downtime, significantly impacting customer service and satisfaction.
2 - Moderate Impact
The gap affects some aspects of the business, but the overall impact is manageable. It may cause some inefficiencies or misalignment but does not critically impair operations. Ex: A gap that leads to data inconsistencies, requiring additional manual work to maintain data accuracy but not significantly disrupting operations.
1 - Minor Impact
The gap has a minimal effect on the organization. It may cause minor inefficiencies or slight misalignment but does not significantly impact overall performance. Ex: A gap that slightly delays reporting processes but does not affect decision-making timelines.
Example Scenario
| Dimension | Impact | Justification for current capability |
|---|---|---|
| Technology Alignment | 2 | The domain collects basic data on inventory levels, inbound and outbound shipments, and warehouse capacity utilization. However, data from warehouse management systems (WMS) is not fully integrated with enterprise systems. |
| Accessibility | 3 | There are inconsistencies in inventory data due to manual data entry errors and lack of real-time updates, leading to discrepancies in stock levels. |
| Technology Alignment | 3 | High reliance on legacy systems with limited integration capabilities. Most data is stored in siloed databases, and analytics is performed using basic SQL queries and Excel spreadsheets. |
| Data Quality | 2 | Basic reports are generated on warehouse performance metrics, such as order fulfillment rates, but these reports are often outdated and lack actionable insights. |
| Business Performance | 1 | Predictive analytics capabilities are nonexistent. The organization does not forecast demand or optimize warehouse layouts based on data-driven insights. |
| Data Culture | 1 | Decisions in warehouse operations are predominantly made based on past experiences and intuition rather than data-driven insights. There is a lack of data literacy among warehouse management and staff. |
Step 2. Future State: Relevant and viable
Very often organizations define a future state first before assessing the current state. This creates misunderstanding on what the future-state is and why we need it. I recommend that we perform an as-is current state assessment first so that we can define a relevant future state. This future state becomes the objectives and initiatives are creates to resolve them.
So it is important that the defined future state be treated like objectives and define them SMART objectives—Specific, Measurable, Achievable, Relevant, and Time-bound—because they are clearly defined and structured to drive impactful improvements in the organization’s operations.
Example Scenario
For the gaps defined above Here’s how each objective aligns with the SMART criteria. I recommend to explicitly call out the SMART criteria and communicate them so that we can get agreement that they are actionable, aligned with business goals, and capable of driving meaningful improvements in warehouse operations.
1. Mordernize Data Collection: A comprehensive system that automatically collects and integrates data from all warehouse operations, including real-time tracking of inventory levels, shipment status, and equipment usage.
- Specific: The objective explicitly mentions the creation of a comprehensive system that automates data collection and integration from all warehouse operations.
- Measurable: Success can be measured by the extent of automation, the number of processes integrated, and the availability of real-time data.
- Achievable: With the right technology and resources, implementing an automated data collection system is feasible.
- Relevant: This objective addresses the critical need for real-time and accurate data, which is essential for efficient warehouse operations.
- Time-bound: Although a specific timeline isn’t mentioned, this could be achieved within a set period, such as “within 12 months.”
2. Data Quality: High data accuracy and consistency, with automated processes to minimize manual entry errors and ensure real-time updates of inventory and operations data.
- Specific: The objective focuses on improving data accuracy and consistency while minimizing manual entry errors.
- Measurable: Data accuracy and consistency can be measured by tracking error rates, the frequency of data updates, and the reduction in manual entries.
- Achievable: With automated processes and data validation tools, high data quality is an attainable goal.
- Relevant: Ensuring high data quality is critical for reliable reporting, decision-making, and maintaining operational efficiency.
- Time-bound: This could be time-bound by specifying that data quality improvements should be realized “within the next 6 months.”
**3. Analytics Infrastructure: A modern, cloud-based infrastructure that centralizes all warehouse data, supports advanced analytics, and integrates seamlessly with other enterprise systems.**
- Specific: The objective is to build a modern, cloud-based analytics infrastructure that centralizes warehouse data and integrates with other systems.
- Measurable: Success can be measured by the implementation of the infrastructure, the centralization of data, and the integration with existing systems.
- Achievable: Given the availability of cloud solutions and analytics platforms, this objective is realistic with proper planning and resources.
- Relevant: A robust analytics infrastructure is crucial for supporting advanced analytics, which is vital for modern warehouse operations.
- Time-bound: A specific timeline, such as “within 18 months,” would make this objective time-bound.
4. Descriptive Analytics: Real-time dashboards and reports that provide actionable insights into key performance metrics, such as inventory turnover, order accuracy, and warehouse efficiency.
- Specific: The objective aims to create real-time dashboards and reports that offer insights into key warehouse metrics.
- Measurable: This can be measured by the number of dashboards created, their usage by staff, and the frequency of real-time updates.
- Achievable: With existing analytics tools, developing real-time dashboards is feasible.
- Relevant: Descriptive analytics are essential for monitoring warehouse performance and making informed decisions.
- Time-bound: This could be specified with a timeline such as “within 6 months.”
5. Predictive Analytics: Implementation of predictive models for demand forecasting, stock optimization, and warehouse layout planning to improve operational efficiency and reduce costs.
- Specific: The objective focuses on implementing predictive models for demand forecasting, stock optimization, and warehouse layout planning.
- Measurable: The impact of predictive models can be measured by improvements in forecast accuracy, stock levels, and operational efficiency.
- Achievable: With advanced analytics tools and data scientists, building predictive models is realistic.
- Relevant: Predictive analytics can significantly enhance operational efficiency and reduce costs, aligning with strategic goals.
- Time-bound: A timeline such as “within 12 months” could make this objective time-bound.
6. Data Culture: A culture where data is the basis for decision-making in warehouse operations. Increased data literacy among staff, enabling them to use analytics tools effectively. >. Can you explain why these are SMART objectives
- Specific: The objective is to foster a data-driven culture where decisions are based on data, and to improve data literacy among staff.
- Measurable: Success can be measured by the number of staff trained, the frequency of data-driven decisions, and the use of analytics tools.
- Achievable: With training programs and leadership support, a data-driven culture can be cultivated.
- Relevant: A strong data culture ensures that the organization fully leverages its data assets to improve operations.
- Time-bound: This objective could be made time-bound by setting a target such as “within 9 months.”
3. Data Architecture Gaps Analysis
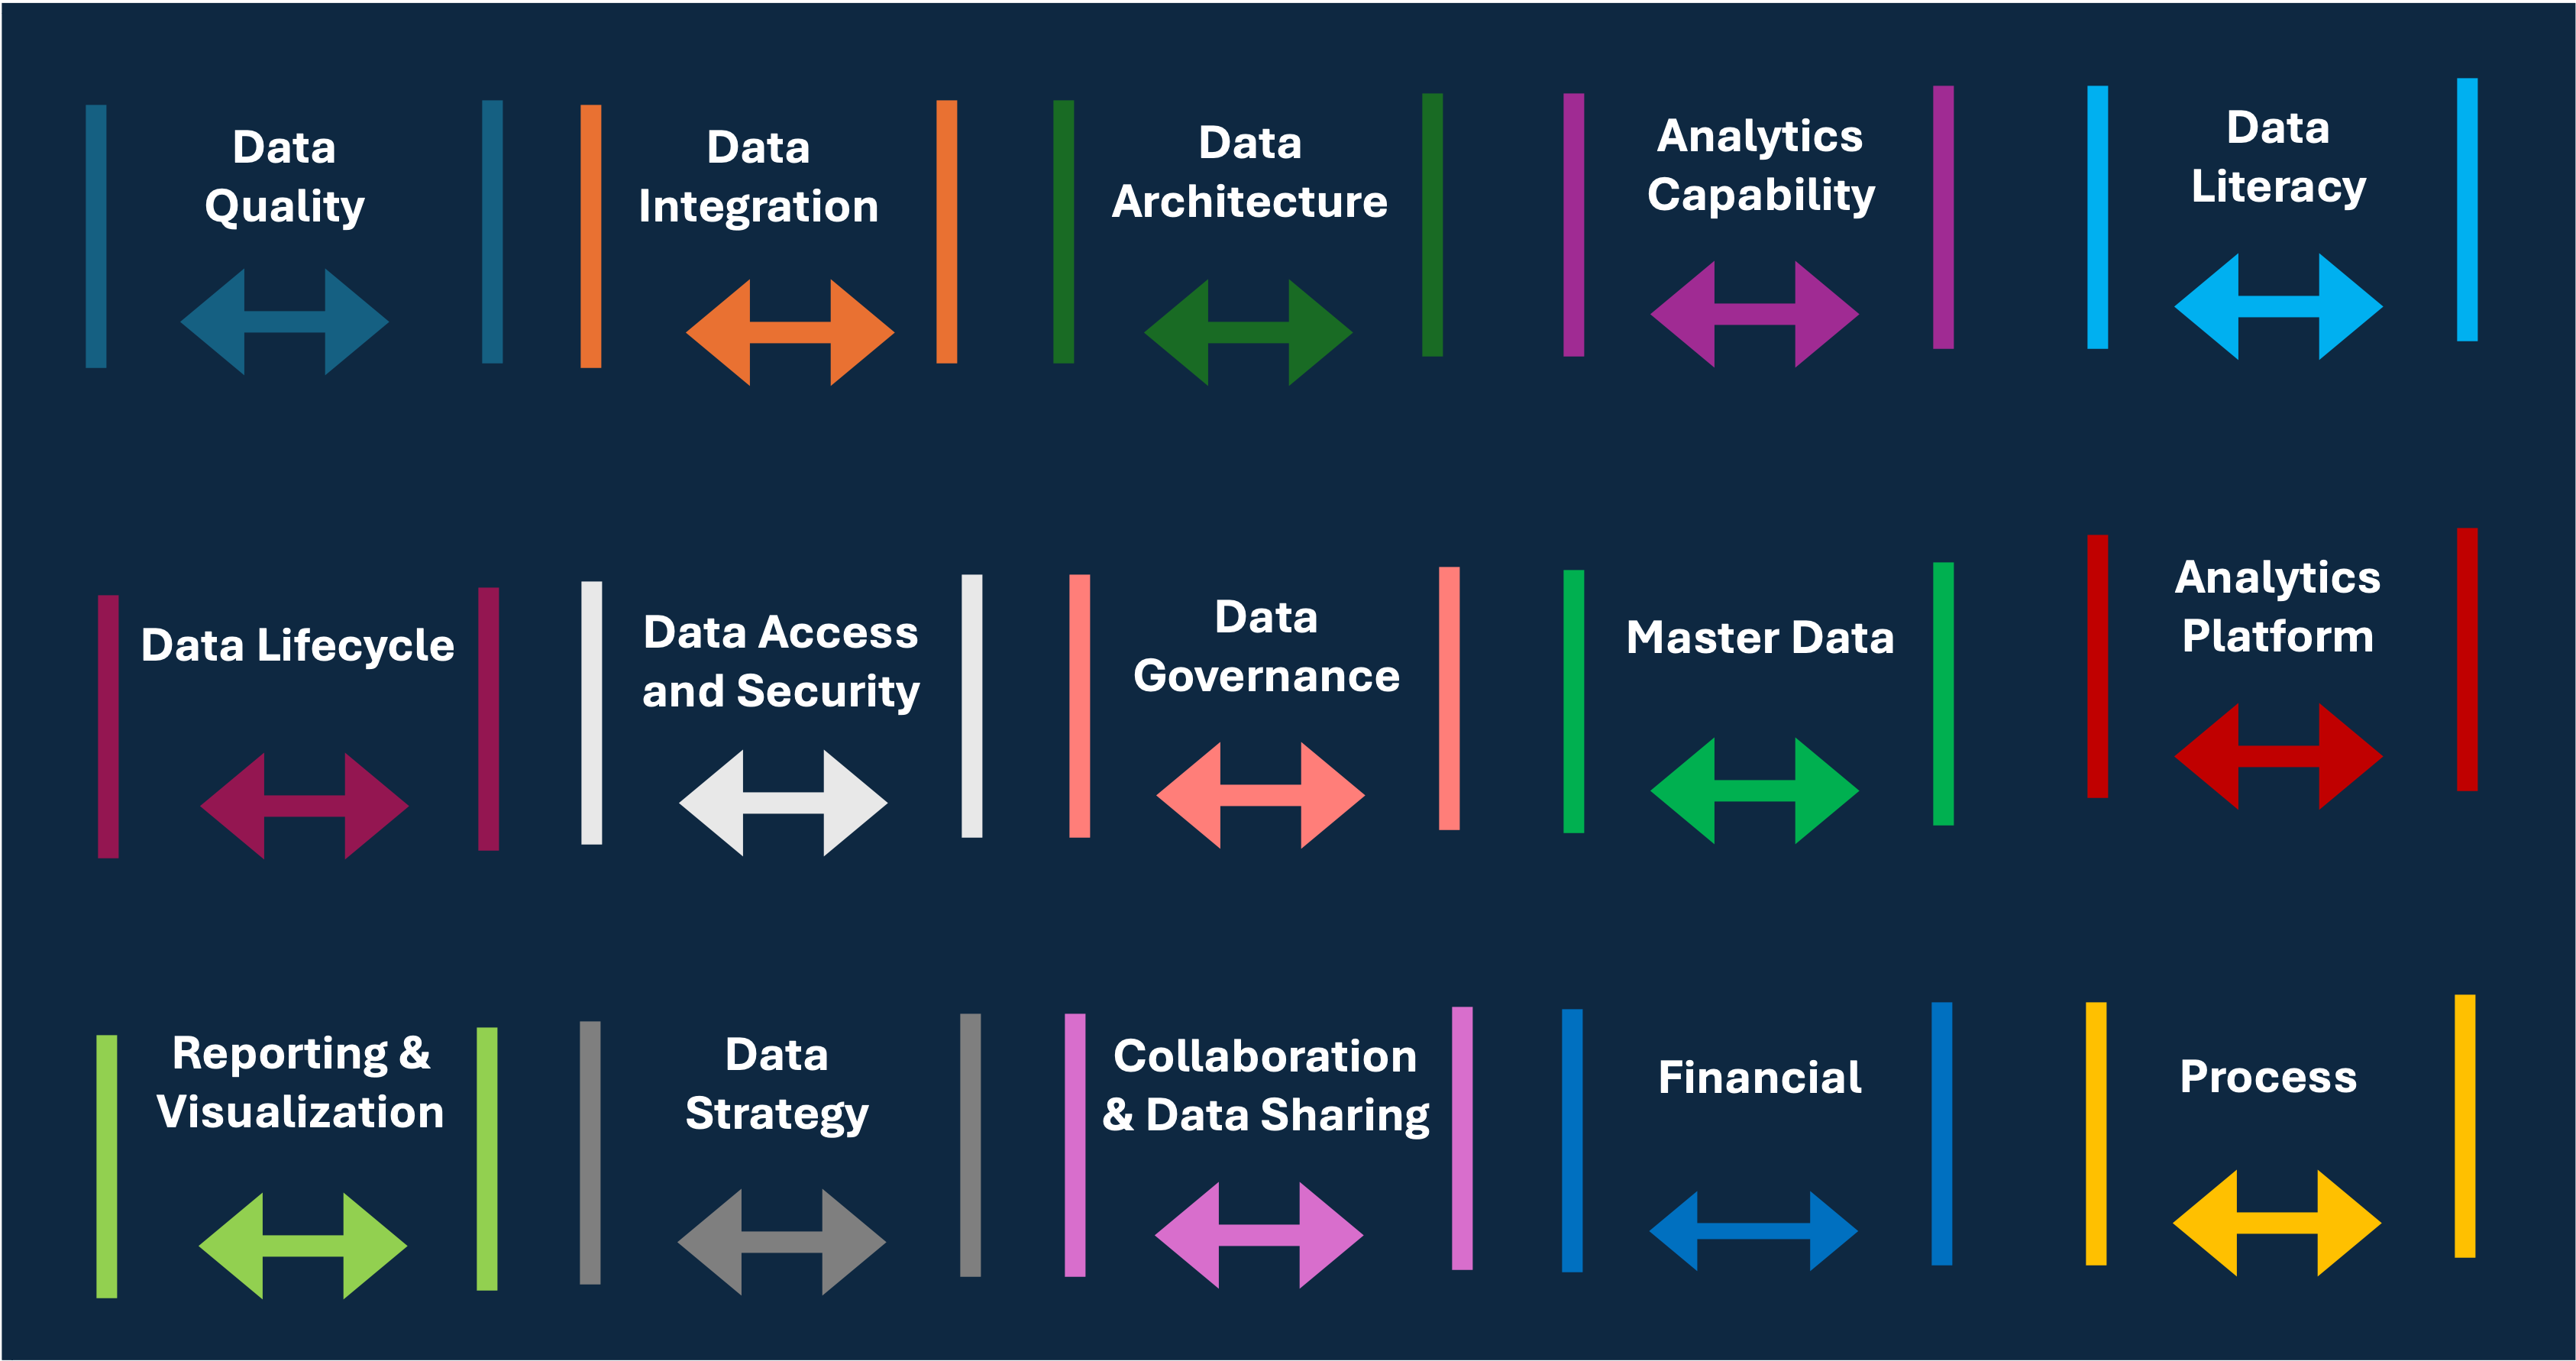
Gap Assessment Framework
Below is a Gap Assessment Framework based on the lessons learnt on the multiple programs I have supported.
| Gap | Description |
|---|---|
| Data Quality Gaps | Data Accuracy Gaps: Presence of errors, inconsistencies, or inaccuracies in data. Data Timeliness Gaps: Delays in data availability or updates leading to outdated information. Data Completeness Gaps: Missing data or incomplete datasets affecting analysis. Data Consistency Gaps: Inconsistent data across different systems or platforms. Data Timeliness Gaps: Delays in data availability or updates leading to outdated information. Data Standardization Gaps: Lack of standardized data formats, units, or definitions across the organization. |
| Data Integration Gaps | System Integration Gaps: Inability to integrate data across different systems or platforms. Real-Time Data Integration Gaps: Challenges in integrating real-time data streams from multiple sources. Data Silo Gaps: Data trapped in silos, limiting its availability and use across the organization. API Gaps: Lack of or inadequate APIs for data exchange between systems. ETL Process Gaps: Inefficiencies or limitations in Extract, Transform, Load (ETL) processes. |
| Data Architecture Gaps | Scalability Gaps: Data architecture that cannot scale to meet growing data volumes or complexity. Flexibility Gaps: Inability to adapt the data architecture to new business needs or technologies. Cloud Adoption Gaps: Inadequate use of cloud technologies for data storage, processing, or analytics. Data Storage Gaps: Insufficient or inappropriate data storage solutions, including lack of data lakes or warehouses. Data Security Architecture Gaps: Gaps in the architecture related to data encryption, access control, and secure data storage. |
| Analytics Capability Gaps | Descriptive Analytics Gaps: Inadequate tools or processes for generating accurate reports and dashboards. Predictive Analytics Gaps: Lack of advanced analytics capabilities like predictive modeling and forecasting. Prescriptive Analytics Gaps: Absence of tools or expertise for prescriptive analytics to recommend actions. Self-Service Analytics Gaps: Insufficient self-service tools for business users to perform their own analyses. Advanced Analytics Gaps: Gaps in capabilities like AI, machine learning, or big data analytics. |
| Data Literacy Gaps | Skill Gaps: Lack of skills among employees to effectively interpret and use data. Training Gaps: Insufficient training programs to improve data literacy across the organization. Data Understanding Gaps: Gaps in understanding data assets, their value, and how they should be used. Cultural Gaps: Resistance to data-driven decision-making or a lack of data culture. |
| Data Lifecycle Management Gaps | Data Retention Gaps: Inadequate policies or practices for retaining data over its lifecycle. Data Archiving Gaps: Lack of or insufficient processes for archiving historical data. Data Disposal Gaps: Poor practices for securely disposing of outdated or unnecessary data.</li>Data Versioning Gaps: Inability to manage and track versions of data over time. |
| Data Access and Security Gaps | Access Control Gaps: Inadequate control over who can access different data assets. Data Encryption Gaps: Lack of encryption for sensitive data, both in transit and at rest. Authentication Gaps: Weak authentication mechanisms for accessing data systems. Audit and Monitoring Gaps: Lack of tools or processes to monitor data access and usage. Incident Response Gaps: Gaps in the ability to respond to data breaches or security incidents. |
| Data Governance Gaps | Data Ownership Gaps: Lack of clear ownership for data assets across the organization. Data Stewardship Gaps: Insufficient or unclear data stewardship roles and responsibilities. Compliance Gaps: Failure to meet data-related regulatory requirements (e.g., GDPR, CCPA). Data Policy Gaps: Lack of comprehensive data policies covering data privacy, security, usage, and retention. Data Cataloging Gaps: Absence of a centralized data catalog to facilitate data discovery and lineage tracking. |
| Master Data Management (MDM) Gaps | Master Data Governance Gaps: Lack of governance frameworks for managing master data. Data Entity Gaps: Gaps in the identification and management of key data entities (e.g., customer, product). Data Consistency Gaps: Inconsistent master data across systems leading to operational inefficiencies. Hierarchy Management Gaps: Challenges in managing data hierarchies and relationships. Data Synchronization Gaps: Inefficiencies in keeping master data synchronized across systems. |
| Data Analytics Platform Gaps | Platform Usability Gaps: Analytics platforms that are not user-friendly or require extensive technical expertise. Performance Gaps: Analytics platforms that do not meet performance expectations (e.g., slow query times). Integration Gaps: Challenges in integrating analytics platforms with other enterprise systems. Tool Gaps: Missing or outdated tools within the analytics platform. Scalability Gaps: Platforms that cannot scale to handle increased data volumes or complexity. |
| Data Reporting and Visualization Gaps | Visualization Tool Gaps: Lack of advanced or user-friendly visualization tools. Reporting Frequency Gaps: Inadequate reporting frequency that doesn’t meet business needs. Customization Gaps: Lack of ability to customize reports and dashboards to meet specific user requirements. Mobile Reporting Gaps: Insufficient support for accessing reports and dashboards on mobile devices. Interactive Reporting Gaps: Limited interactivity in reports and dashboards for deeper analysis. |
| Data Strategy Gaps | Alignment Gaps: Misalignment between data strategy and overall business strategy. Innovation Gaps: Lack of innovation in data practices, such as adopting new technologies or methodologies. Investment Gaps: Insufficient investment in data and analytics capabilities. Roadmap Gaps: Absence of a clear roadmap for developing and enhancing data capabilities. |
| Collaboration and Data Sharing Gaps | Data Sharing Gaps: Inefficiencies or barriers to sharing data across departments or with external partners. Collaboration Tool Gaps: Lack of tools to facilitate collaboration around data and analytics. |
| Financial Gaps | Budgetary Gaps: Insufficient budget to meet operational or strategic needs. Cost Management Gaps: Inefficient cost control leading to overspending or financial waste. Revenue Gaps: Shortfalls in expected revenue or failure to capitalize on revenue opportunities. Investment Gaps: Lack of investment in key areas, such as technology or human resources, affecting growth. Financial Risk Gaps: Exposure to financial risks that are not adequately mitigated. Resource Allocation Gaps: Inefficient allocation of financial resources across projects or departments. ROI Gaps: Poor return on investment for certain initiatives or projects. |
| Process Gaps | Process Inefficiencies: Redundant or overly complex processes leading to delays and wasted resources. Lack of Standardization: Inconsistent processes across departments or teams. Compliance Gaps: Processes not aligned with regulatory or industry standards. Automation Gaps: Manual processes that could be automated for greater efficiency. Documentation Gaps: Inadequate or outdated process documentation. Process Alignment Gaps: Misalignment between processes and business objectives. Change Management Gaps: Ineffective handling of process changes or updates. |
For each gap, we define the urgency on how quickly the gap needs to be addressed to prevent further issues or capitalize on opportunities. Measurement Scale:
- Low Urgency (1): Can be addressed over time without immediate risk.
- Medium Urgency (2): Should be addressed soon to prevent potential issues.
- High Urgency (3): Needs prompt attention to avoid significant impact.
- Critical (4): Requires immediate action due to severe risk or opportunity.
| Dimension | Gaps | Urgency | Justification of Gap |
|---|---|---|---|
| Data Integration | System Integration Gaps | 2 | Current systems lack the ability to integrate data from various warehouse operations and enterprise systems, resulting in siloed data that hinders comprehensive analysis. |
| Data Integration | Real-Time Data Processing | 2 | The legacy systems do not support real-time data processing, leading to delays in updating inventory levels and shipment status. |
| Process | Manual Data Entry | 2 | Reliance on manual data entry introduces errors and inconsistencies, affecting data quality and accuracy. |
| Process | Outdated Reporting | 2 | Reports are generated manually and are often outdated, providing limited value for decision-making. |
| Skills and Knowledge | Predictive Analytics Expertise | 2 | There is no in-house expertise in predictive analytics to forecast demand, optimize stock levels, or improve warehouse layout. |
| Skills and Knowledge | Data Literacy | 2 | Warehouse staff and management lack the skills to interpret data and utilize advanced analytics tools effectively. |
| Cultural | Data-Driven Decision-Making | 2 | The organization does not consistently use data to drive decisions in warehouse operations, leading to inefficiencies and missed opportunities for optimization. |
4. Strategic Initiatives to Close Gaps
Strategic Initiatives Prioritization Framework
Prioritizing multiple strategic initiatives requires a structured approach that balances various factors such as impact, urgency, cost, alignment with organizational goals, and resource availability.

Define Evaluation Criteria
Establish clear criteria to evaluate and compare each initiative. Common criteria include:
- Strategic Alignment: How well does the initiative align with the organization’s strategic goals and objectives?
- Impact: What is the potential benefit or value generated by the initiative? (e.g., revenue growth, cost savings, competitive advantage)
- Urgency: How time-sensitive is the initiative? Does it address a critical issue or opportunity?
- Cost: What are the financial implications, including both initial investment and ongoing costs?
- Resource Availability: Are the necessary resources (e.g., budget, personnel, technology) available to execute the initiative?
- Risk: What are the risks associated with implementing or not implementing the initiative?
- Feasibility: How realistic is it to achieve the initiative’s objectives given current constraints?
Score Each Initiative
For each criterion, assign a score to each initiative. You can use a scale (e.g., 1 to 5) where higher scores represent greater alignment, impact, urgency, etc. Here’s an example scoring system:
- Strategic Alignment: 1 (low alignment) to 5 (critical alignment)
- Impact: 1 (minor) to 5 (extensive)
- Urgency: 1 (low urgency) to 5 (critical urgency)
- Cost: 1 (very high) to 5 (very low)
- Resource Availability: 1 (scarce resources) to 5 (abundant resources)
- Risk: 1 (high risk) to 5 (low risk)
- Feasibility: 1 (low feasibility) to 5 (high feasibility)
Weight the Criteria
Not all criteria are equally important. Assign weights to each criterion based on its significance to the organization. For example:
- Strategic Alignment: 30%
- Impact: 25%
- Urgency: 20%
- Cost: 10%
- Resource Availability: 5%
- Risk: 5%
- Feasibility: 5%
Rank the Initiatives
Rank the initiatives based on their composite scores. Higher scores indicate higher priority. Multiply the score for each criterion by its weight and sum these values to obtain a composite score for each initiative. This will give you an overall ranking of the initiatives.
Composite Score = ∑(Score for Criterion×Weight for Criterion)
Identify any interdependencies between initiatives. For example, some initiatives may need to be completed before others can start. Adjust the prioritization to reflect these dependencies.
| Domain | Initiative | Urgency | Justification of Gap |
|---|---|---|---|
| Technology | Centralized Data Platform | 3 | Deploy a cloud-based data warehouse that integrates data from warehouse management systems (WMS), enterprise resource planning (ERP) systems, and other relevant sources. This platform should support real-time data processing and advanced analytics. |
| Technology | Adopt Real-Time Data Collection Tools | 2 | Implement IoT sensors and automated data collection tools to track inventory levels, equipment usage, and shipment status in real time, reducing reliance on manual data entry. |
| Process Improvement | Automate Data Quality Management | 4 | Introduce automated data quality checks and validation processes to minimize errors from manual data entry and ensure accurate, consistent data across systems. |
| Process Improvement | Develop Real-Time Dashboards | 1 | Implement business intelligence (BI) tools like Power BI or Tableau to create real-time dashboards that provide warehouse managers with actionable insights into key performance metrics. |
| Skill Development | Invest in Predictive Analytics Training | 3 | Provide training to warehouse data analysts and IT staff on predictive modeling techniques, demand forecasting, and optimization algorithms. Consider hiring data scientists with expertise in supply chain analytics. |
| Skill Development | Enhance Data Literacy | 2 | Launch data literacy programs targeted at warehouse management and staff to improve their ability to understand and act on data insights. This could include workshops, online courses, and ongoing support. |
| Cultural Change Initiatives | Promote Data-Driven Decision-Making | 4 | Encourage a shift towards data-driven decision-making by setting expectations at the leadership level and recognizing teams that successfully implement data-driven strategies. |
| Cultural Change Initiatives | Foster Collaboration | 1 | Create cross-functional teams that include data experts and warehouse operations personnel to work together on data-driven projects, such as optimizing warehouse layout or improving inventory accuracy. |